Analytics
One of the most important issues in exchange trading is the choice of a trading pair. When trading on a grid of orders, the grid parameters are also important. There are more than 1000 trading pairs on the Binance exchange today - the question arises: which one to choose for maximum profit? Below we will consider what is needed to answer this crucial question.
The idea is to check on historical data how the grid bot would trade on each pair and with different parameters. The parameters are the width of the grid and the step of the grid. One trading pair with certain parameters, on which the simulation of trading (hereinafter referred to as simulation) is carried out, as a result gives the calculated percent per annum. Percent per annum allows you to compare different trading pairs at different periods with each other.
It is impossible to perform this amount of calculations manually, so we have implemented 2 tools:
- Application to collect all actual trade data in real time
- Application to simulate the trades of each trading pair with different parameters
Collection of actual data
No analysis can be done without actual trades, and the more data and the more accurate it is, the better the analysis will be. Our application collects data on all Binance trading pairs in real time without collapsing by period and stores it in the database. The database volume is huge and reaches tens of gigabytes in one month.
You can read more about price data here.
Simulation
The following data is required for the simulation:
- Trades data for the period of interest. The period can be any, but in general, the more data, the more averaged data is obtained and the less likely it is that there will be a significant deviation from the past result in the future. We do simulations on 1 month, 3 months, and 6 months of data. The longer the period, the more data, the longer the simulation runs.
- Entry(start) point. In real life, you can try to look for the optimal entry point, waiting for a fall or rise in the rate, but in the simulation, this moment is simplified. We select the first point in the data array for the period and consider it to be the entry point. In fact, it corresponds to the strategy of entering the market at the current rates.
- Grid step. We perform simulations with grid steps equal to 1,2,3,4,5,6,7,8,9,10 percent of the price. The grid step is closely related to the grid width.
- Grid width. The total width of the grid is defined as the width of the upper part of the grid from the entry point and the lower part. The upper and lower parts may be different and are determined dynamically depending on the minimum and maximum price values during the analyzed period. The trading pairs with the ratio of the maximum price to the minimum price over 50 during the analyzed period are ignored. There are not many of such pairs, but calculation by them turns out to be very long, and the data are somewhat distorted, because it is impossible to predict such volatility in the future.
The simulation is very computationally expensive, so it takes a considerable amount of time to get the data. It takes approximately:
- 1 month ~ 2-3 days
- 3 months ~ 5-7 days
- 6 months ~ 14-16 days
Simulation result
The result is presented as an Excel file containing simulation data. For different tariff plans there are limits for maximum profitability of annual:
- Lite - up to 100% per annum.
- Pro - Up to 500% per annum.
- Unlimit - no restrictions
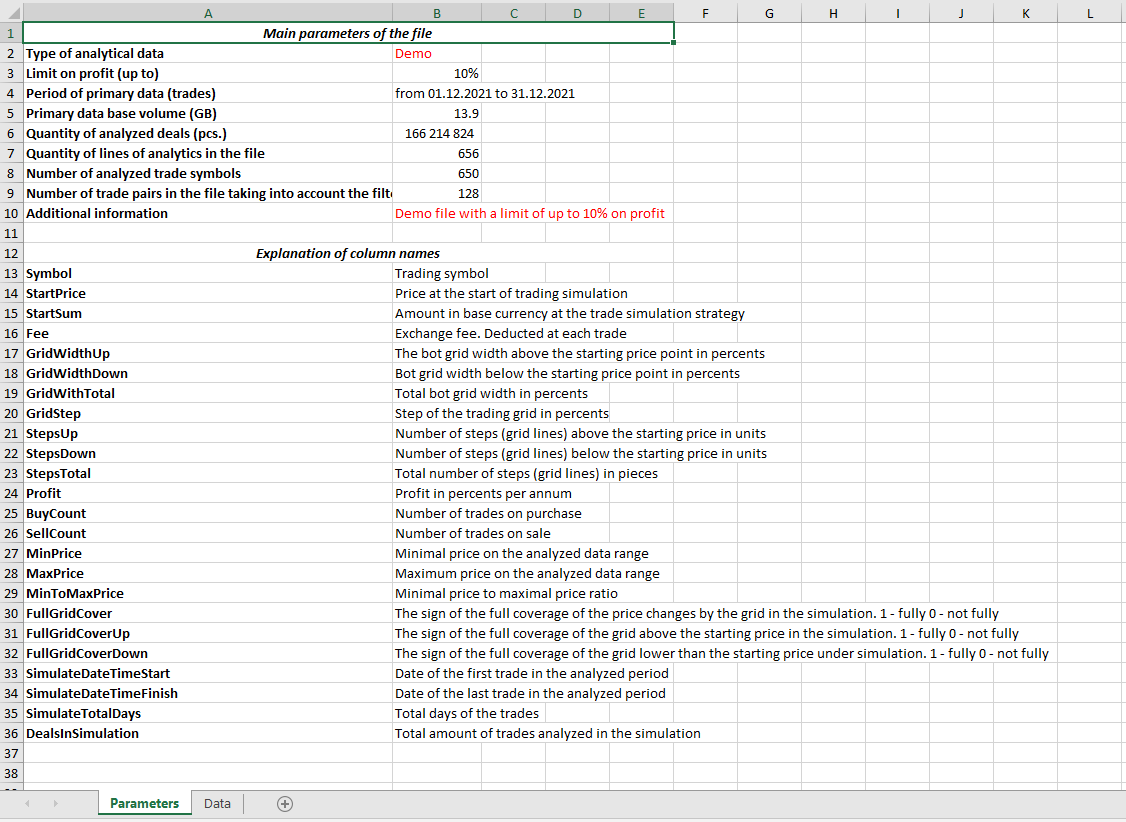
The "Data" sheet directly shows the results of the simulations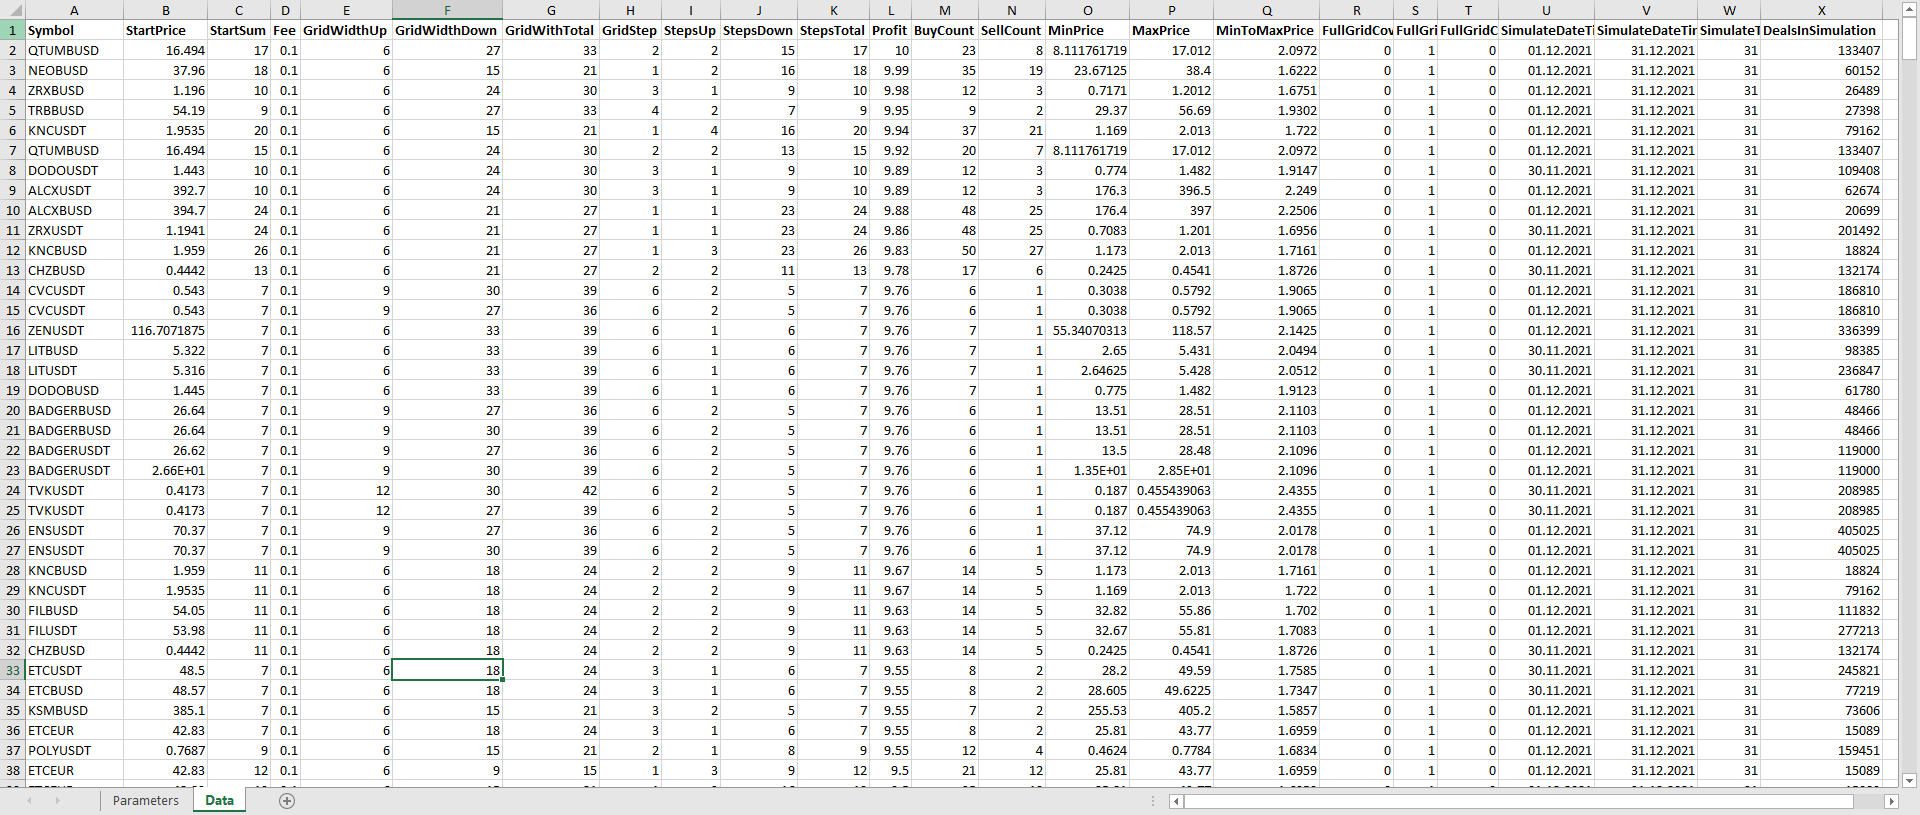
The demo file can be downloaded here
It's very important!!!
How to get
To get the file with simulation results visit our online store and select the data period and tariff you need https://www.gridbot.info/en/shop/gridanalitics.
After payment you will receive a link to download the file or receive it by mail specified in the order.